Fig. 2. Global gene expression profile of AMM/I. (A) Heat map results after microarray analysis. (B) ELISA for IL-10 in the AMM/I and AMM. The amount of IL-10 was markedly higher in AMM/I than AMM. **p < 0.01; n = 4 per group.
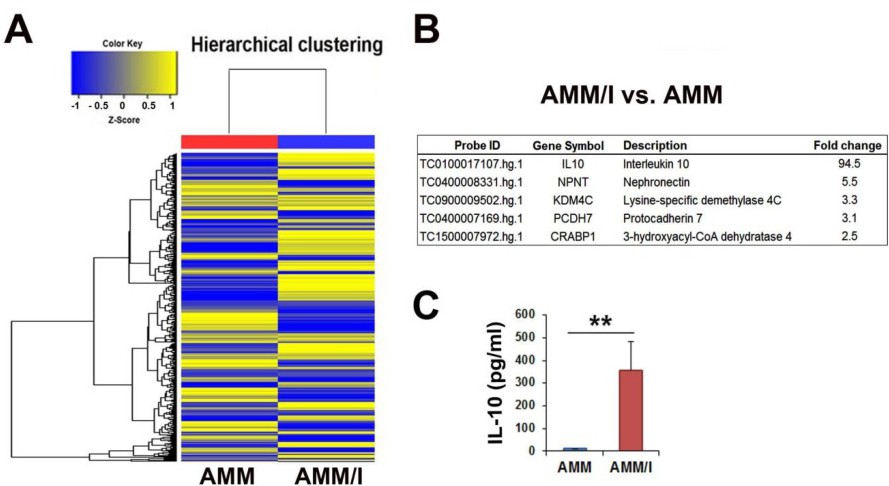
Fig. 2. Global gene expression profile of AMM/I. (A) Heat map results after microarray analysis. (B) ELISA for IL-10 in the AMM/I and AMM. The amount of IL-10 was markedly higher in AMM/I than AMM. **p < 0.01; n = 4 per group.